Rosim – Insights
Use of design storms

When we perform a capacity assessment of a pipe network, we aim to determine the maximum flow the network can be expected to handle—for example, for 10-year or 25-year return periods—because we need to understand how often the system may experience flooding.
The most intuitive way to determine this would be to calculate pipe flow using 50 years of precipitation data. The highest flow computed over those 50 years would correspond to an event occurring once in that period—a 50-year return period—while the second-highest flow would correspond to an event occurring twice in 50 years, i.e., a 25-year return period.
Since running computations with hydraulic models remains time-consuming, in most cases it would take too long to simulate 50 continuous years of rainfall to perform a capacity assessment of a pipe network. It is therefore still an impractical approach.
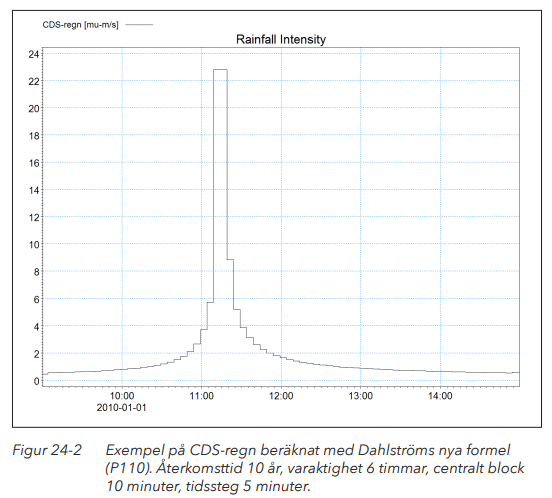
To address the issue of long computation times, practitioners have for many years used synthetic design storms derived from rainfall statistics for use in hydraulic calculations. Examples include block storms, the Chicago Design Storm (CDS), the Sifalda storm, and triangular storms.
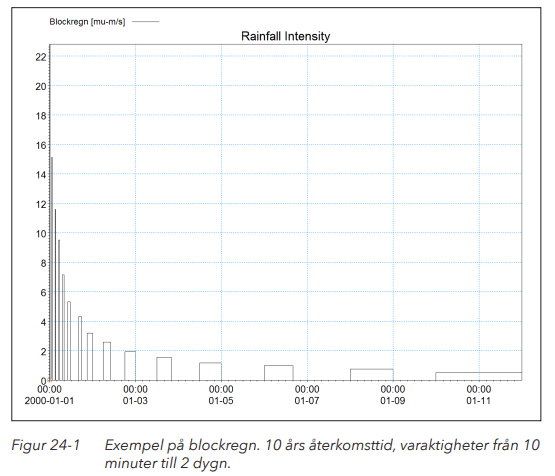
In Svenskt Vatten Utveckling Report No. 2016-15, “Guidelines for Modelling of Wastewater-Conveying Systems and Stormwater Systems,” we find these figures illustrating examples of the Chicago Design Storm (CDS) and what is referred to as block rain (blockregn):


To construct the block storm, one generates constant-intensity “block” storms (kasseregn) for all durations—typically from 5 minutes up to one day—using the same return period (e.g., 10-year), based on IDF (IVF) curves from met.no.
Each block is spaced in time so that the calculation for the preceding block storm does not affect the next. Because the computations are performed with a hydrological model, the block storms are inserted into an actual precipitation time series, ensuring that the storages (reservoirs) in the model have a natural filling level at the start of each block storm.
After the computations, some pipes will exhibit their highest flow for a block storm with a 15-minute duration. Others will peak for a block storm lasting 3 hours, and so on.
We compared the results from block-storm simulations with those from modelling all significant rainfall events over a 50-year precipitation record. The block-storm approach shows relatively good agreement with the statistically more rigorous “all storms” method.
In our projects, we have therefore largely adopted the use of block storms when estimating how frequently flooding can be expected to occur in the stormwater and wastewater system.
Latest posts
- All Posts
- What’s happening?
- Insights

 NO
NO
 SE
SE

